
Snapshot 4
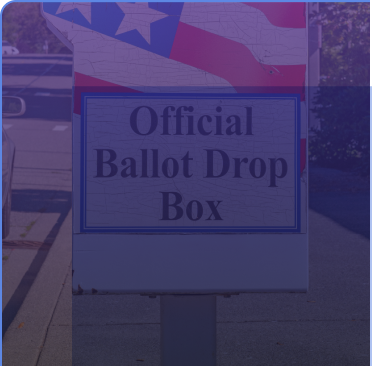
Safety Measures at the Polls
Safety Measures at the Polls
How election officials, election workers, law enforcement, and state legislators protect voters–and where there’s room for improvement
Voters overwhelmingly support safety measures at polling places—and many of these measures are already in place. But gaps remain between what voters want and what processes are currently in place to ensure all voters feel safe while voting.
This snapshot explores what safety measures were implemented in 2024, what safety measures voters want in place, and how trust in public officials influences perceptions of safety.
Voter Priorities
Voters Support a Range of Safety Measures at the Polls
I
wish
you
could
pick
the
polling
location,
so
you
could
go
where
you
feel
comfortable.
If
you
felt
that
sense
of
community
where
you
voted,
you
would
be
comfortable
regardless
of
how
you
vote,
how
you
dress,
and
you
could
vote
in
person
rather
than
it
being
always
by
— Black independent gender-nonconforming votermail.
If
someone
is
fearful,
they
could
make
an
appointment
or
someone
could
be
there
to
secure
them.
Or
have
a
number,
like
a
711,
you
can
dial
when
you
see
something,
so
people
know
we
take
security
— White Republican woman voterseriously.
There
are
still
areas
for
improvement.
For
instance,
there
isn’t
always
sufficient
lighting
or
security
in
the
parking
areas,
which
can
make
some
voters
feel
unsafe,
especially
after
— White Democratic woman voterdark.
I
think
having
presence
of
some
sort
of
security
or
neutral
people
around.
And
moving
a
little
bit
faster,
because
the
less
time
people
have
to
mingle,
the
less
chance.
So,
maybe
more
polling,
less
lines,
less
interaction
with
other
people
that
could
spark
that
opportunity,
and
a
little
bit
more
security
and
neutrality
in
the
voting
areas
— White Independent woman votermaybe.
At
the
polling
places,
if
they
could
post
a
sign
or
a
taped
message
from
candidates
from
both
sides
and
say,
‘Respect
your
neighbors.
Don’t
incite
violence.’
A
lot
of
this
country
thinks
Trump
did
incite
violence,
so
if
both
sides
were
to
say,
‘We
don’t
want
violence,’
there’s
a
— White Republican woman voterchance.
Both before and after the election, when asked about safety measures at polling places, voters broadly supported a range of security efforts—especially shorter lines and security cameras at polling places.
These preferences were similar across gender, race, and political affiliation, highlighting a meaningful area of agreement: Voters want polling places to feel safe and orderly.
However, law enforcement, election officials, and election workers may underestimate how widely voters approve of some election security measures.
Both before and after the election, when asked about safety measures at polling places, voters broadly supported a range of security efforts—especially shorter lines and security cameras at polling places.
These preferences were similar across gender, race, and political affiliation, highlighting a meaningful area of agreement: Voters want polling places to feel safe and orderly.
However, law enforcement, election officials, and election workers may underestimate how widely voters approve of some election security measures. These public officials perceive more variability in whether or not voters approve of certain measures, while voters’ actual approval is generally high
Shorter lines, security cameras, and background checks were the highest priorities for most voters.
Shorter lines, security cameras, and background checks were the highest priorities for most voters.
'%3e%3cline%20x1='108.079'%20y1='95.6011'%20x2='108.079'%20y2='-73.7079'%20stroke='%235D87E3'/%3e%3cline%20x1='85.5049'%20y1='95.6011'%20x2='85.5049'%20y2='-73.7079'%20stroke='%235D87E3'/%3e%3cline%20x1='62.9302'%20y1='95.6011'%20x2='62.9302'%20y2='-73.7079'%20stroke='%235D87E3'/%3e%3cline%20x1='40.3557'%20y1='95.6011'%20x2='40.3557'%20y2='-73.7079'%20stroke='%235D87E3'/%3e%3cline%20x1='17.7812'%20y1='95.6011'%20x2='17.7813'%20y2='-73.7079'%20stroke='%235D87E3'/%3e%3cline%20x1='123.629'%20y1='81.0515'%20x2='-45.6798'%20y2='81.0514'%20stroke='%235D87E3'/%3e%3cpath%20d='M123.629%2057.9771L-45.6798%2057.9771'%20stroke='%235D87E3'/%3e%3cline%20x1='123.629'%20y1='35.9023'%20x2='-45.6798'%20y2='35.9022'%20stroke='%235D87E3'/%3e%3cline%20x1='123.629'%20y1='13.3276'%20x2='-45.6798'%20y2='13.3275'%20stroke='%235D87E3'/%3e%3c/g%3e%3cdefs%3e%3cclipPath%20id='clip0_4238_16423'%3e%3crect%20width='123.732'%20height='95.6858'%20fill='white'%20transform='matrix(-1%200%200%20-1%20124.366%2095.9883)'/%3e%3c/clipPath%3e%3c/defs%3e%3c/svg%3e)
Americans’ perceived usefulness of safety measures, pre-election, and approval of measures, post-election
View chart by
Not useful
1
2
3
4
Very useful
5
Shorter lines
4.2
Security cameras
4.1
Poll worker background checks
4.0
Law enforcement on site
3.9
Regulations against lingerers
3.9
Firearm bans
3.9
Barriers against lingerers
3.7
Security screening
3.6
Explore voter preferences on election safety in the
Election administrators perceived shorter lines and firearm bans to be voters’ biggest priorities.
Election administrators perceived shorter lines and firearm bans to be voters’ biggest priorities.
Public officials’ perceptions of voter approval of safety measures, post-election
View chart by
Election officials
Election workers
All disapprove
1
2
3
4
All approve
5
Shorter lines
4.0
4.3
Regulations against lingerers
3.4
3.4
Law enforcement on site
3.4
3.4
Poll worker background checks
3.3
3.7
Security cameras
3.3
3.5
Firearm bans
3.3
4.0
Barriers against lingerers
3.1
3.2
Security screening
2.5
2.8
Explore perceived approval of election safety measures in the
Recommendation 4
Public officials should consider which election safety policies voters want. Voters approve of a range of safety steps, including shorter lines, security cameras, barriers to prevent lingering, and firearm bans.

Administrators’ Views
Election Administrators Implemented Many Safety Measures–But Not Universally
Americans perceive voter safety to be the shared responsibility of many groups. They want law enforcement, election officials, state policymakers, local community leaders, national political leaders, and election workers to all play a role in voter safety.
The public officials that we surveyed reported that many of the safety measures voters want—such as security cameras and firearm bans—were implemented in some jurisdictions.
However, many measures were only implemented by a small percentage of jurisdictions, leaving room for improvement.
Americans perceive voter safety to be the shared responsibility of many groups. They want law enforcement, election officials, state policymakers, local community leaders, national political leaders, and election workers to all play a role in voter safety.
The public officials that we surveyed reported that many of the safety measures voters want—such as security cameras and firearm bans—were implemented in some jurisdictions. However, many measures were only implemented by a small percentage of jurisdictions, leaving room for improvement.
Voters hold many groups of public officials responsible for voter safety—including law enforcement, election officials, and state policymakers.
Voters hold many groups of public officials responsible for voter safety—including law enforcement, election officials, and state policymakers.
Voters’ perceptions of who is responsible for voter safety, pre- and post-election
Pre-election
Post-election
Not responsible
1
2
3
4
Completely responsible
5
Law enforcement
Election officials
State policymakers
Local community leaders
National political leaders
Election workers
Other voters
Influencers
Armed militias
Explore perception of responsibility in the
Fewer than half of surveyed jurisdictions implemented each major safety measure except for minimizing long lines.
Fewer than half of surveyed jurisdictions implemented each major safety measure except for minimizing long lines.
Share of public officials reporting each voting safety measure in place in their jurisdiction, post-election
View chart by
Yes
Don't know/not sure
No
0%
25%
50%
75%
100%
Minimizing long lines
60%
2%
39%
Firearm bans
44%
3%
53%
Regulations to prevent lingering
40%
3%
57%
Security cameras
27%
6%
67%
Physical barriers to prevent lingering
15%
2%
83%
Background checks on election workers
13%
7%
80%
Screening at entrances
7%
1%
92%
Explore implementation gaps in election safety in the
Keeping
voters
safe
from
intimidation
is
paramount
for
protecting
our
democracy.
I
have
legislated
in
this
— State legislator, CTarea.
Perception
is
reality
for
many
people.
I
want
them
to
feel
secure
in
— State legislator, IDvoting.
Listen
to
the
concerns
and
try
to
explain
how
the
system
works.
We
must
bring
about
the
feelings
of
safety
in
our
election
— State legislator, KSprocess.
I
have
spoken
with
people
who
do
not
vote
in
person
anymore
due
to
concerns
about
Election
Day
violence.
If
the
legislature
were
to
try
and
strip
them
of
their
ability
to
vote
absentee,
we
would
have
a
serious
— State legislator, WYproblem.
I
would
continue
to
support
countywide
early
voting
access,
as
I
know
some
voters
who
are
afraid
to
vote
at
specific
— State legislator, NCplaces.
Recommendation 5
Communicate to voters a list of specific safety measures already in place at their polling places.
Trust and Accountability
Voters Who Trust Election Officials Feel Safer at the Polls
Americans vote more confidently when they trust the state and local officials who run elections—including law enforcement, election officials, election workers, and policymakers. Americans we surveyed who expressed high trust in election officials, election workers, law enforcement, and state legislators were more likely to say they felt safe voting than those who did not trust those groups.
This relationship highlights the importance of transparency and communication—when voters understand the security measures in place and trust the officials implementing them, their confidence in election safety increases.
The more voters trust public officials to run safe elections, the safer they feel.
The more voters trust public officials to run safe elections, the safer they feel.
Americans’ perceptions of personal safety based on trust in public officials, pre-election
Safe while voting
Neutral
Unsafe
0%
25%
50%
75%
100%
Those who trust public officials
85%
12%
3%
Those who are neutral
65%
30%
5%
Those who distrust public officials
57%
28%
16%
Explore trust in public officials in the
Data Playground
Explore Voter Safety Measures and Trust in Public Officials
View mode
Not at all useful
1
2
3
4
Very useful
5
Law enforcement on site
4.0
Security screening at entrances
3.7
Bans on firearms
3.9
Security cameras
4.1
Physical barriers to distance people from lingering close to a polling place
3.7
Regulations to prevent people from lingering close to a polling place
3.9
Procedures to minimize long lines waiting to vote
4.1
Background checks on election workers who staff polling places
3.9